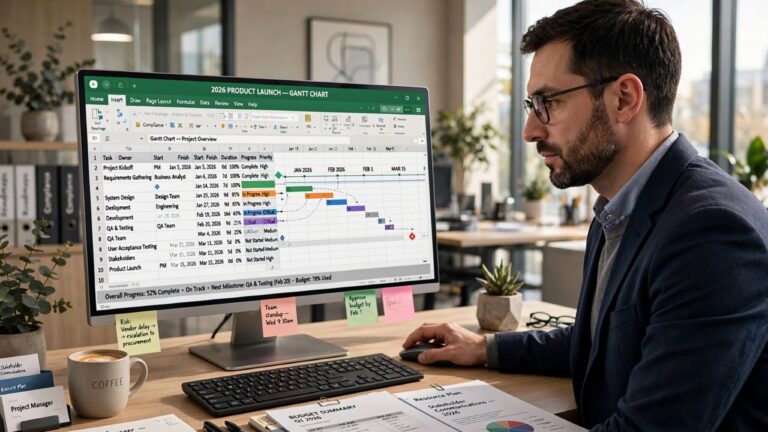
Managing projects successfully requires clear timelines, organized tasks, and effective progress tracking. A well-designed project schedule helps teams stay aligned while ensuring deadlines are visible throughout the project lifecycle. Creating a professional Gantt chart in Excel is one of the most practical ways to organize project activities without investing in specialized project management software.
Microsoft Excel provides flexible tools that allow businesses, project managers, consultants, and freelancers to build customized Gantt charts for projects of almost any size. This guide explains how to create a professional Gantt chart in Excel, its benefits, essential components, and best practices for effective project management.
What Is a Professional Gantt Chart in Excel?
A professional Gantt chart in Excel is a visual project management tool that displays project tasks along a timeline. It helps teams understand when activities begin, how long they last, and how different tasks relate to one another.
A typical Gantt chart includes:
- Project tasks
- Start dates
- End dates
- Duration
- Milestones
- Progress indicators
- Timeline
Excel allows users to customize these elements based on project requirements.
Why Use a Professional Gantt Chart in Excel?
Excel remains one of the most widely used business applications because it is flexible, familiar, and accessible.
A professional Gantt chart in Excel can help:
- Organize project schedules
- Track deadlines
- Monitor task progress
- Improve team communication
- Identify scheduling conflicts
- Support project reporting
The level of customization makes Excel suitable for many business environments.
Benefits of a Professional Gantt Chart in Excel
Easy Project Visualization
Instead of reviewing long task lists, project teams can quickly understand schedules through visual timelines.
This improves planning and communication.
Better Task Organization
Project managers can organize:
- Tasks
- Subtasks
- Milestones
- Deadlines
- Dependencies
Well-structured schedules help reduce confusion.
Improved Progress Tracking
Progress updates can be reflected directly within the chart, making it easier to monitor project status throughout execution.
Flexible Customization
Excel allows users to customize:
- Colors
- Fonts
- Timeline scales
- Task categories
- Conditional formatting
This flexibility supports different project management styles.
Essential Components of a Professional Gantt Chart in Excel
Project Tasks
Begin by listing all project activities in logical order.
Breaking large projects into smaller tasks improves planning accuracy.
Start and End Dates
Each task should include planned start and completion dates.
These dates form the foundation of the project timeline.
Duration
Task duration indicates the expected number of working days or weeks required for completion.
Milestones
Milestones represent important project achievements such as:
- Project kickoff
- Design approval
- Product launch
- Final delivery
They help monitor overall project progress.
Progress Status
Many project managers include completion percentages to monitor ongoing work.
Examples include:
- Not Started
- In Progress
- Completed
Additional status indicators may be used depending on project requirements.
How to Create a Professional Gantt Chart in Excel
Step 1: Prepare Your Project Data
Create columns for:
- Task Name
- Start Date
- End Date
- Duration
- Progress
Organized project data simplifies chart creation.
Step 2: Build the Timeline
Use Excel date columns to represent the project schedule across days, weeks, or months depending on project length.
Step 3: Create the Chart
Many users build Gantt charts using stacked bar charts combined with formatting adjustments.
Excel provides multiple formatting options for customizing project timelines.
Step 4: Customize Appearance
Improve readability by adjusting:
- Colors
- Labels
- Gridlines
- Task bars
- Fonts
Consistent formatting creates a more professional presentation.
Step 5: Update Progress
As the project advances, update task completion status and schedule changes to maintain accurate reporting.
Best Practices for Building a Professional Gantt Chart in Excel
Keep the Design Simple
Avoid unnecessary formatting that distracts from important project information.
Simple layouts are easier to read.
Use Consistent Colors
Apply consistent color coding for:
- Active tasks
- Completed tasks
- Milestones
- Delayed activities
Color consistency improves visual understanding.
Highlight Critical Milestones
Important project events should stand out clearly from routine activities.
Review the Timeline Regularly
Projects often change.
Regular updates help ensure the schedule remains accurate.
Common Uses for Gantt Charts
Businesses use Gantt charts for:
Construction Projects
Track planning, procurement, construction, inspections, and project completion.
Marketing Campaigns
Manage content calendars, advertising campaigns, product launches, and promotional activities.
Software Development
Monitor development phases including:
- Planning
- Design
- Development
- Testing
- Deployment
Business Operations
Project timelines support:
- Process improvement
- Internal initiatives
- Strategic planning
- Department coordination
Common Mistakes to Avoid
When creating a professional Gantt chart in Excel, avoid:
- Missing task dependencies
- Unrealistic deadlines
- Overly complicated formatting
- Failing to update progress
- Omitting milestones
Clear planning improves project management.
Alternatives to Excel Gantt Charts
While Excel works well for many projects, larger organizations may also use dedicated project management software with advanced scheduling features.
Choosing the appropriate tool depends on project complexity, team size, collaboration needs, and reporting requirements.
Frequently Asked Questions
1. What is a professional Gantt chart in Excel?
A professional Gantt chart in Excel is a visual project schedule that displays tasks, timelines, milestones, and project progress using Microsoft Excel.
2. Why should I use Excel for Gantt charts?
Excel offers flexibility, customization, widespread availability, and sufficient functionality for many small and medium-sized projects.
3. Can Excel track project progress?
Yes. Excel allows users to update task completion, timelines, milestones, and progress throughout the project lifecycle.
4. What information should a Gantt chart include?
A Gantt chart typically includes task names, start dates, end dates, durations, milestones, and progress indicators.
5. Is Excel suitable for large projects?
Excel can manage many projects effectively, although larger or highly complex projects may benefit from specialized project management software.
6. How often should I update my Gantt chart?
Project schedules should be reviewed and updated regularly to reflect completed work, timeline adjustments, and changing project priorities.
Conclusion
A professional Gantt chart in Excel remains one of the most practical and cost-effective tools for planning, organizing, and monitoring projects. By presenting tasks, timelines, milestones, and progress in a clear visual format, it helps project managers improve communication, allocate resources more effectively, and keep projects on schedule. Whether you’re managing a business initiative, marketing campaign, construction project, or software development effort, building and maintaining a professional Gantt chart in Excel can provide greater visibility into project performance and support more informed decision-making throughout every stage of the project.